Freelance / Case study
Full-Stack Developer & BI Engineer
SalesLens BI

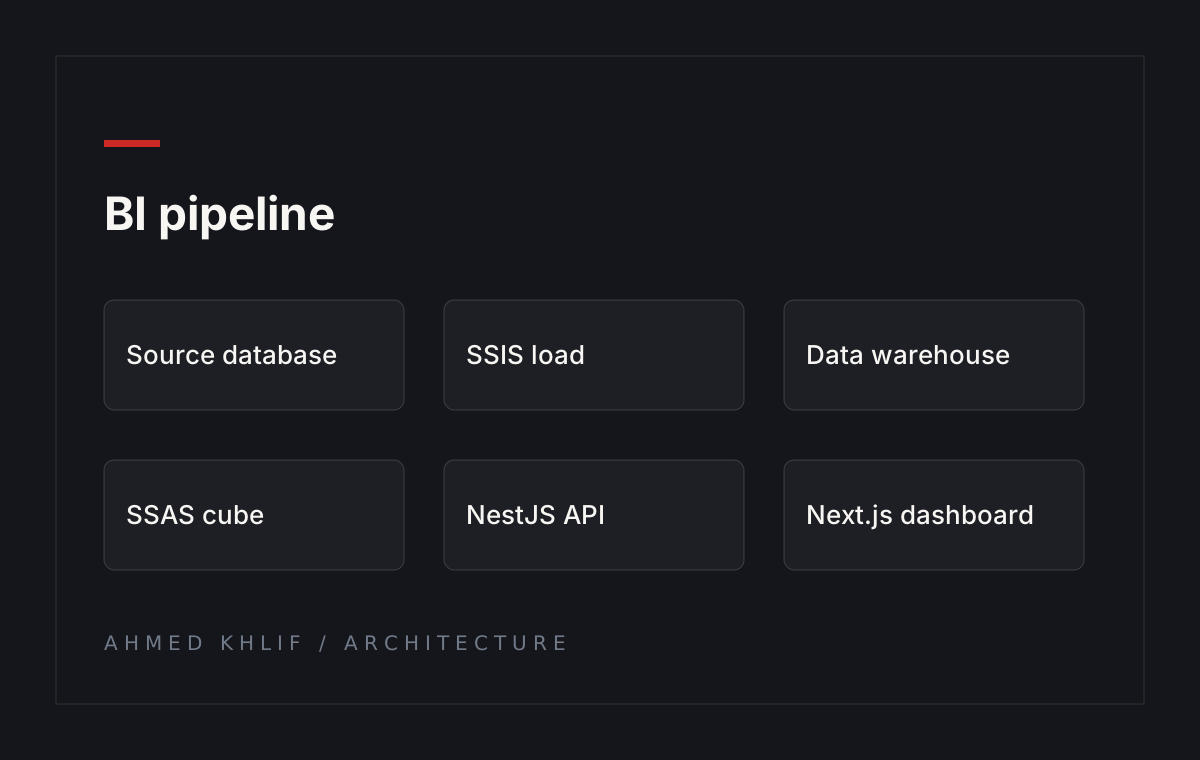
Source DB → SSIS → warehouse → SSAS cube → API → dashboard
Executive overview plus products, customers, reps and time analysis
Global filter bar shared across every page
Reports and CSV-style exports instead of spreadsheet digging
Tech Stack
Description
SalesLens BI is an end-to-end sales analytics platform. Rather than analysing an operational database directly, the project models the data properly: source database → SSIS → data warehouse → SSAS multidimensional cube.
On top of the cube I built a NestJS analytics API and a Next.js dashboard, with shared contract types between them so the front end and API cannot drift apart.
The dashboard is built for exploration rather than one-off reports: an executive overview plus products, customers, sales reps, time analysis, calendar, explorer, reports and settings routes.
A single global filter bar is shared across every page, so narrowing to a region or period carries through the whole analysis instead of being re-entered page by page. Export capabilities close the loop for people who still need a file.
- Modelled a SQL Server data warehouse and SSAS multidimensional cube for sales analysis.
- Built a NestJS analytics API with shared TypeScript contracts to the front end.
- Delivered a Next.js dashboard with an executive overview and dedicated analysis routes.
- Implemented a global filter bar shared across all pages plus export capabilities.
- Covered products, customers, sales reps, time, calendar, explorer and reports views.
Page Info
BI architecture
An SSAS multidimensional cube sits on a modelled data warehouse loaded through SSIS. A NestJS API exposes the analytics, and a Next.js dashboard turns them into answers.
Dashboard surface
Executive overview, products, customers, sales reps, time analysis, calendar, explorer, reports and settings — all driven by one shared global filter.